Watch a dozen charts at once
Put as many live charts as your plan allows on one page, open it in its own tab or on a second monitor, and keep an eye on your whole watchlist without switching symbols.
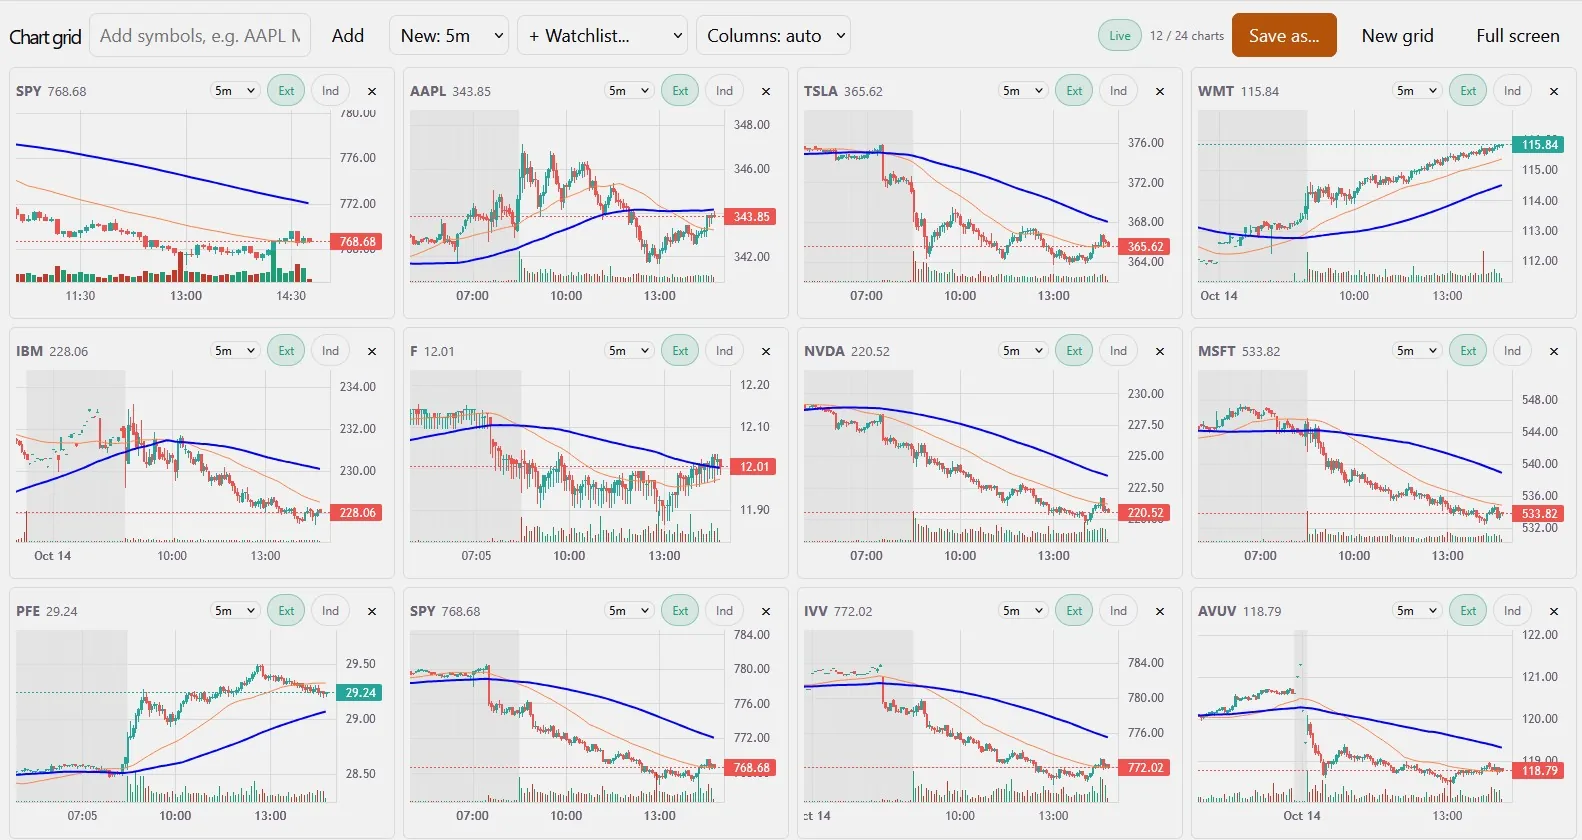
The chart grid is a page of live charts, each with its own symbol and timeframe, that fits your window with no scrolling. Open it in its own browser tab (or on a second monitor), add symbols by typing them (or, on Trader and Pro, by pulling in a whole watchlist), and the layout arranges itself - or choose one to six columns yourself. Full screen puts the whole grid on the screen and hides everything else.
Every chart keeps its own indicators. Add a moving average to one, RSI and VWAP to another, and each cell remembers its own set - without changing the indicators on your Trade chart. Pre-market and after-hours bars can be switched on or off per chart, drag a chart by its header to put it where you want it, and click a symbol's name to open it on the Trade page (or in Replay on a plan with no Trade page).
The forming candles of all your charts arrive over one live connection, so a bigger grid doesn't slow the rest of the app down. How many charts a grid holds depends on your plan: 6 on Analyst, 12 on Trader and 24 on Pro. Save a grid under a name (up to ten) and open it on any device; the one you were looking at is remembered, so a new tab opens where you left off.
A grid is made to be left running. While it is on screen and live, it keeps your session from timing out for up to eight hours after you last touched it, then the usual 15-minute inactivity sign-out applies again. It is read-only: nothing on the grid places or changes an order.
See plansDisciplined. Automatic. Instant.
QuantmHQ enforces the risk limits you set on every order and gets you into a trade in seconds — automated discipline, without slowing you down.
Start your free trial